

Energy Audits Using Thermographic Technology in Northwest Arkansas
INSTEAD OF WASTING MONEY ON UTILITIES, CONSIDER THERMAL EVALUATION & GUIDED RETROFITTING AS THE BEST RETURN ON INVESTMENT
Professional Energy Audits in Fayetteville, Rogers, Springdale, Bentonville & All of NWA
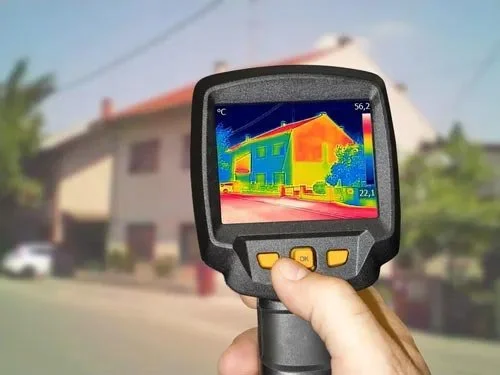
With rising utility costs becoming a significant portion of household expenses, energy efficiency is your best defense against escalating bills. Advanced Inspection Services uses state of the art infrared thermographic technology to identify energy waste and provide cost-effective solutions for Northwest Arkansas homeowners as well as commercial properties.

Thermographic Energy A Audit Services
It is a common misperception that Infrared Equipment alone can identify or define energy loss. Without calibration coupled with specialized training, energy data cannot be effectively collected or analyzed which can produce misinformation and is not effective in creating or performing guided correction strategies.
Advanced Infrared Technology
Non-invasive thermal imaging inspections
Identifies heat loss and air leakage
Locates insulation gaps and thermal bridges
Detects HVAC efficiency issues
Comprehensive Energy Analysis
Building envelope assessment
Insulation performance evaluation
Air leakage identification revealing sealing opportunities
Cost-effective retrofit recommendations
Guided by 26 yrs. of Green Building Experience & LEED AP Certification
Why Thermographic Energy Audits Work
✓ See the Unseen
Infrared cameras reveal energy loss invisible to the naked eye
✓ Non-Invasive
No disruption to occupants or building contents
✓ Immediate Results
Real-time thermal imaging shows problem areas
✓ Targeted Solutions
Precise identification leads to cost-effective retrofitting insulation solutions
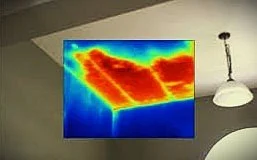
Missing Vaulted Ceiling Insulation in a Ten Year old Residential Building
Expert Analysis & Solutions
LEED AP O&M Certified Professional
Peter Roe brings nationally certified LEED AP OM (Accredited Professional for Existing Buildings) expertise, combining thermographic analysis with decades of renovation experience to provide:
Specific retrofit strategies
Prioritized improvement recommendations
ROI analysis for energy improvements
Implementation guidance
Common Energy Loss Areas We Identify
Windows & Door Frames
Attic & Basement Insulation Gaps
Electrical Outlets & Fixtures
HVAC Duct Work Issues
Foundation & Rim Joist Areas
Roof & Wall Penetrations
Thermal Bridging
Attic & Wall Insulation Performance
Serving Northwest Arkansas
Primary Service Areas: Fayetteville • Rogers • Springdale • Bentonville
Also Serving: Cave Springs • Bella Vista • Lowell • Northwest Arkansas Surrounding Areas
Our local expertise helps Northwest Arkansas property owners address region-specific energy challenges and climate considerations.
Start Saving Energy Today
Ready to reduce your utility bills with professional thermographic energy analysis? Contact Advanced Inspection Services for a comprehensive energy audit consultation. Call (479) 420-4155.
Professional energy audits provide immediate insights and long-term savings opportunities.
Thermal Imaging Used for Energy Audits

Cost of Energy Over Time


Retrofitting Strategies for Energy Efficiency

Percentage of Utility Cost for Heating, Cooling & Light
